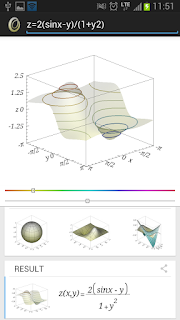
Newton Graphing Calculator Demo
Newton Graphing Calculator Pro
A Little Tale..
I had an intense interest in programming back in my university days by a course on Pascal programming language and algorithm. Back then, there was an assignment to each team of student to draw 2D curve like y=1-x^2. I was fascinated when our team finally got the work done and the graph displayed beautifully ― and correctly of course!. It was the time when MATLAB was the only product available in the market that can do it from command line. A few years later, I came to study in Japan and stumbled into this book by Stephen Wolfram titled Mathematica in the book store. I picked it up and checked the TOC then jumped to a chapter. Lord be hold, how capable this program is. More than just a command line, it is a marvel of language so well designed that deserves a name in its own right: The Wolfram Language. And if you don't know about it, my suggestion is to visit Wolfram Alpha and type something to see for yourself. |
| Newton Graphing Calculator prototype |
 |
Newton Graphing Calculator final UI |
Working on it a few hours a day at night for 6 months, the application was released. I felt tired but happy, especially when seeing that it works well as expected while testing. I have many unit tests to cover the engine part, but the UI still requires extensive testing. I learnt that being persistent and consistent is important, and continuous hard work does bring result in the end. It was quite a fruitful labour.
I named it Newton Graphing Calculator in honour of Sir Isaac Newton who contributed largely in Physics, Calculus and his famous numerical method Newton-Raphson to determine function root, which is used in this program as well.
Contour Plot
Contour plot of single explicit surface z=f(x, y) enables us to visualize the change in altitude of the surface. I divided [z1..z2] into 10 levels, and calculate each level implicit curve of alternate form f(x,y)-C=0 using marching square algorithm. Each level is independent of one another, so they can be done parallely to speed up calculation on mobile device that have multi core. Given the curve, I can draw it before drawing the surface mesh with depth testing to achieve hidden line removal. The result is a fine looking contour plot, but requires more CPU times and consumes more battery. User can opt to display contour curve by the upper left tool bar. |
| Contour plot on opaque surface |
 |
| Contour plot on transparent surface |
 |
| Contour plot at bottom of opaque surface |
 |
| Contour plot at bottom of transparent surface |
Complex Number
 |
| Step by step complex number |
I believe an application gives little value by just showing the final result without step-by-step logic, because user still have to work out the problem by hand to make sure that the result is correct, especially in case symbolic evaluation.
Implicit Surface
 |
| Implicit surface of hyperboloid |
 |
| Ortho circles |
I have to engineer my way out. By reducing redundant vertices from triangle list, I can save space by 80%. GPU bottleneck is not in the rendering but the IO, so this is a huge gain. But the total time is still 4.3 sec. I have to find another way. Multi thread comes to the rescue, because polygonizing each voxel is independent of one another. Given most Android devices shipped with 4 CPU cores, I divide along Z axis into 4 buckets of voxels, then process them in parallel: the delightful result is 2.5 sec, which is still slow but acceptable. One lesson from this work is that engineering & optimization usually leads to a more satisfactory result.
// single thread
02-07 18:57:58.930: SurfaceImplicit  x^2+y^2-(z^2/4)=1
02-07 18:57:58.930: SurfaceImplicit  range  -2.0..2.0  -2.0..2.0  -3.0..3.0
02-07 18:57:58.930: SurfaceImplicit  segment  21
02-07 18:58:03.154: SurfaceImplicit  triangle  4096  vertices  12288  4221ms
02-07 18:58:03.224: SurfaceImplicit  compiled  indices  12288  vertices  2056  75ms
02-07 18:58:03.224: SurfaceImplicit  calculate vertex & color  3ms
02-07 18:58:03.254: SurfaceImplicit  calculate normal  28ms
02-07 18:58:03.264: SurfaceImplicit  took 4337 ms

// parallel in 4 threads
02-07 15:04:30.688: SurfaceImplicit  x^2+y^2-(z^2/4)=1
02-07 15:04:30.698: SurfaceImplicit  range  -2.0..2.0  -2.0..2.0  -3.0..3.0
02-07 15:04:30.698: SurfaceImplicit  segment  21
02-07 15:04:32.900: SurfaceImplicit  triangle  4096  vertices  12288  2215ms
02-07 15:04:33.171: SurfaceImplicit  compiled  indices  12288  vertices  2056  268ms
02-07 15:04:33.171: SurfaceImplicit  calculate vertex & color  3ms
02-07 15:04:33.201: SurfaceImplicit  calculate normal  24ms
02-07 15:04:33.201: SurfaceImplicit  took 2519 ms